Road Crossings
The pipeline model is a crossing of a 36″ potable water transport pipeline with a road. The road is 8 m wide with a roadside of 1 m on each side of the road and ditches alongside the road. The crossing is designed perpendicular to the road-axis and connected with two large radius bends R = 10*D and a angle of 60 degrees.
Pipe data
| Pipe material | API 5L X52 steel |
| Yield stress | 52.000 psi = 358 N/mm2 |
| Outer diameter | 914.4 mm (36″) |
| Wall thickness | 9.52 mm |
| Corrosion allowance | 2 mm |
| Minimum manufacturing tolerance | 5% |
| Maximum operating pressure | 1.0 MPa |
| Transported matter | potable water |
| Deadweight of filled pipe structure | 1.854 kN/m |
Pipeline geometry and side elevation are shown in the figures below.
 Soil data
Soil is assumed to consist of a silty sand with a sub-layer of non-consolidated clay. Road construction will be done after the pipeline was laid, resulting in expected soil settlements of the road-earth body with a maximum of 200 mm at the road-axis location. (consolidation of sub-layer of clay due to increased vertical soil pressure)
Loading data
| Pressure | 1.00 N/mm2 |
| Deadweight | 1.85 N/m |
| Settlements | 200 mm |
Ple4Win Results
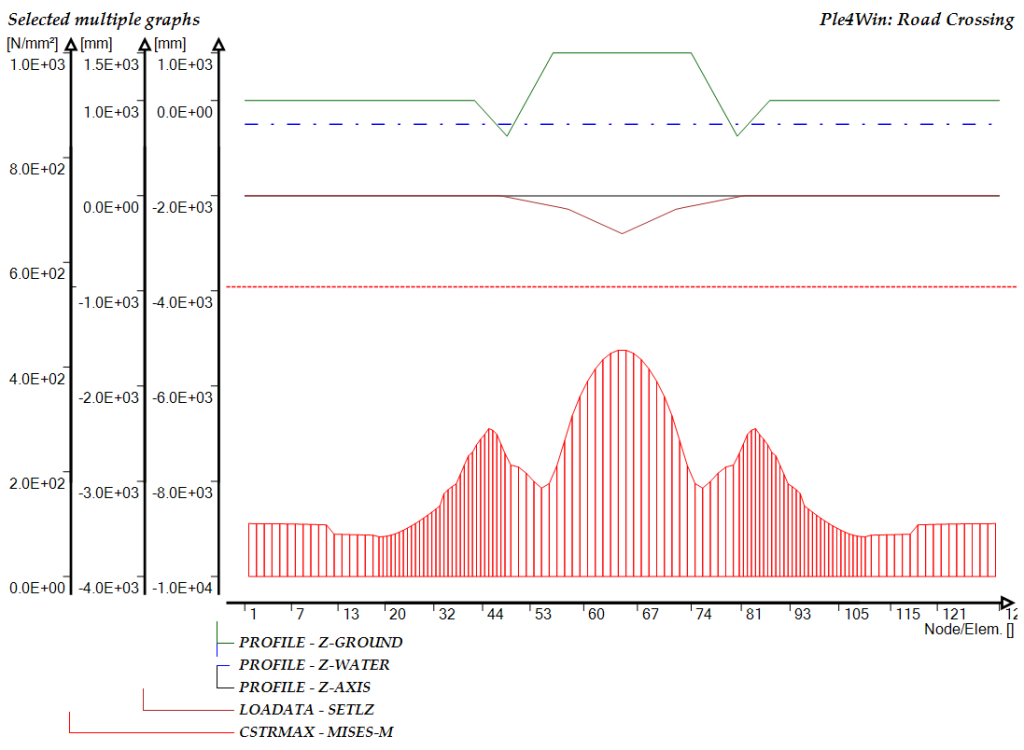
The following graph is produced by means of the Ple4Win program and consists in this case of three result graphs.
- The upper graph shows the surface level of the ground configuration with the water table. As may be seen, there is some water in the ditches.
The horizontal axis is the nodal axis projected on the longitudinal length along the pipe-axis. (various projection axes are possible)
The vertical utmost right axis (length dimension) shows the level and the zeropoint determines the position of the graph. - The middle graph shows the soil settlement distribution. The horizontal axis is the same as above, the vertical axis (length dimension) is the middle axis as the scale and position of the graph differ from the first graph.
- The lower graph shows the combined maximum stress distribution along the pipeline. Horizontal axis again as above, vertical utmost left axis (stress dimension) shows the stress scale. The red line above the graph is the allowable stress.
The overall maximum stress occurs at the middle of the roadcrossing due to pipe bending as a result of the maximum soil settlement